Web & CMS
Shopify
Connect and manage Shopify stores from the desktop. Browse admin, products, orders, and customers.
Analytics
Sales KPIs, charts, and order trends for a selected date range
On this page
The Analytics tab provides sales and order insights for your store.
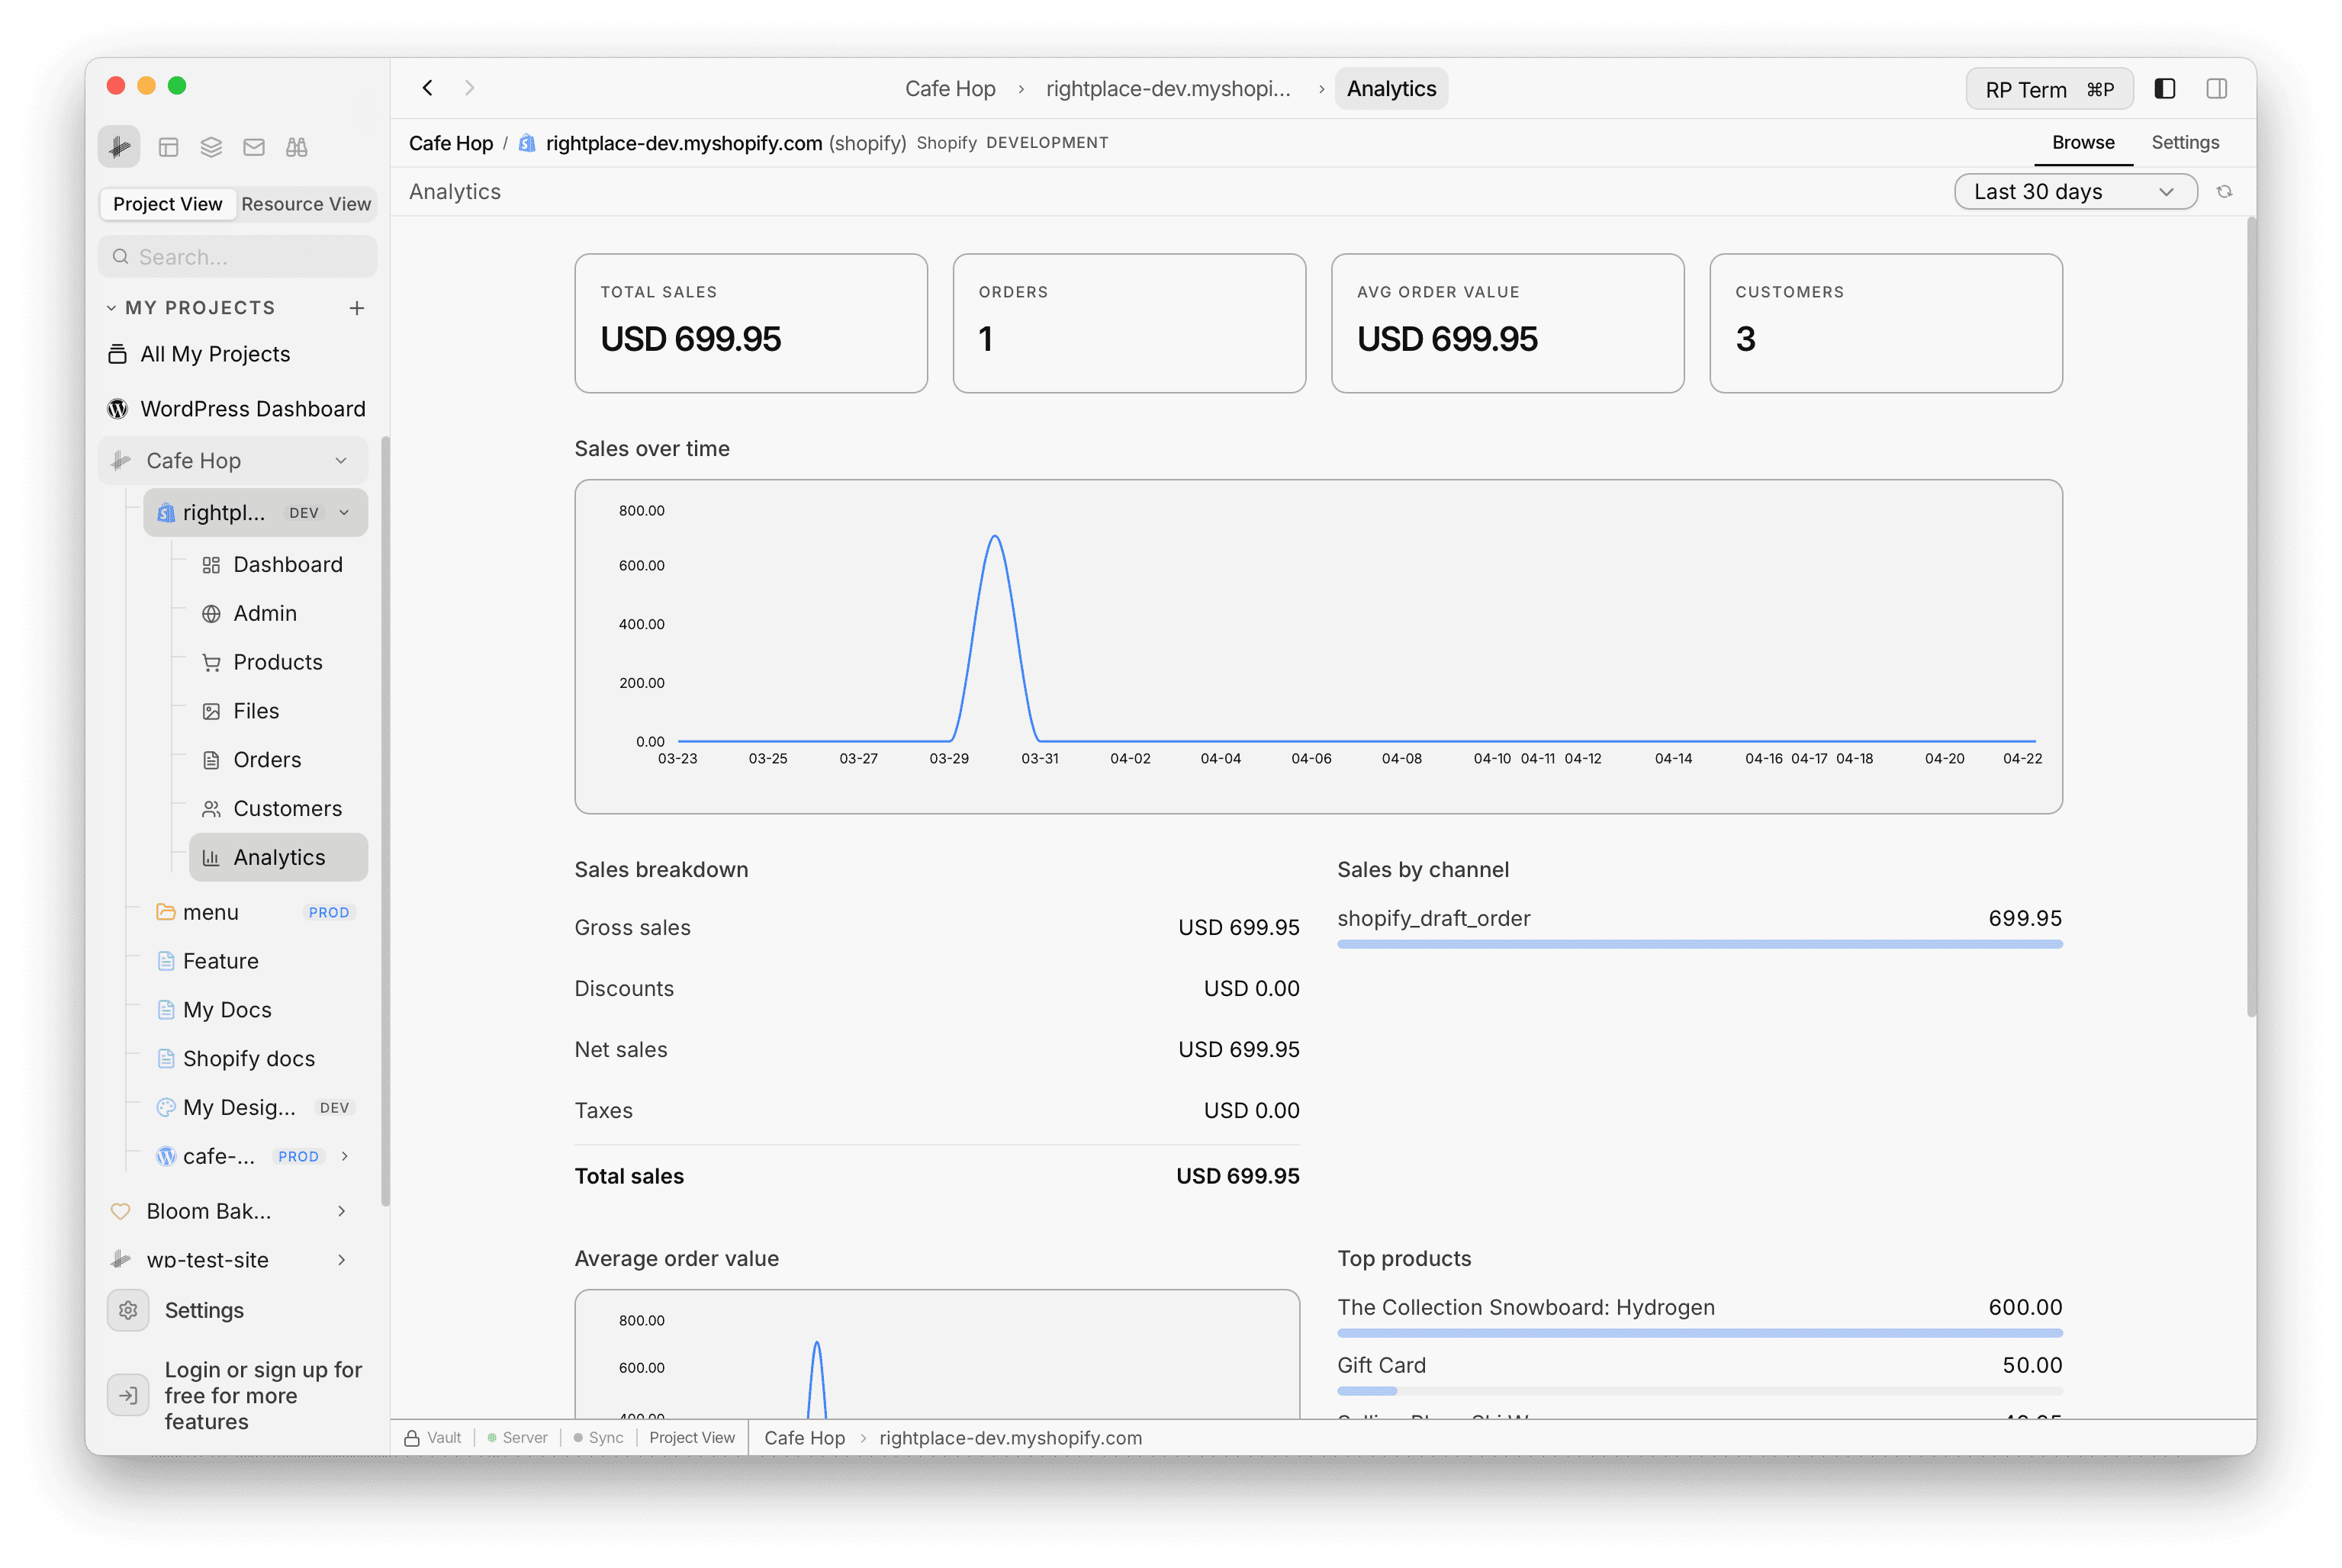
Date range
Select a time period from the picker: Today, Last 7 days, Last 30 days, Last 90 days, or Last 12 months.
KPI cards
Four summary cards at the top:
- Total Sales: total revenue in the selected period
- Total Orders: number of orders
- Average Order Value: mean order total
- Unique Customers: distinct customers who placed orders
Charts and tables
- Sales over time: line chart of revenue by day/week/month
- Sales breakdown: tabular breakdown of sales data
- Sales by channel: revenue split by sales channel
- AOV over time: average order value trend line
- Top products: best-selling products by revenue
- Orders over time: order count trend line
If there are no orders in the selected range, an empty state is shown.