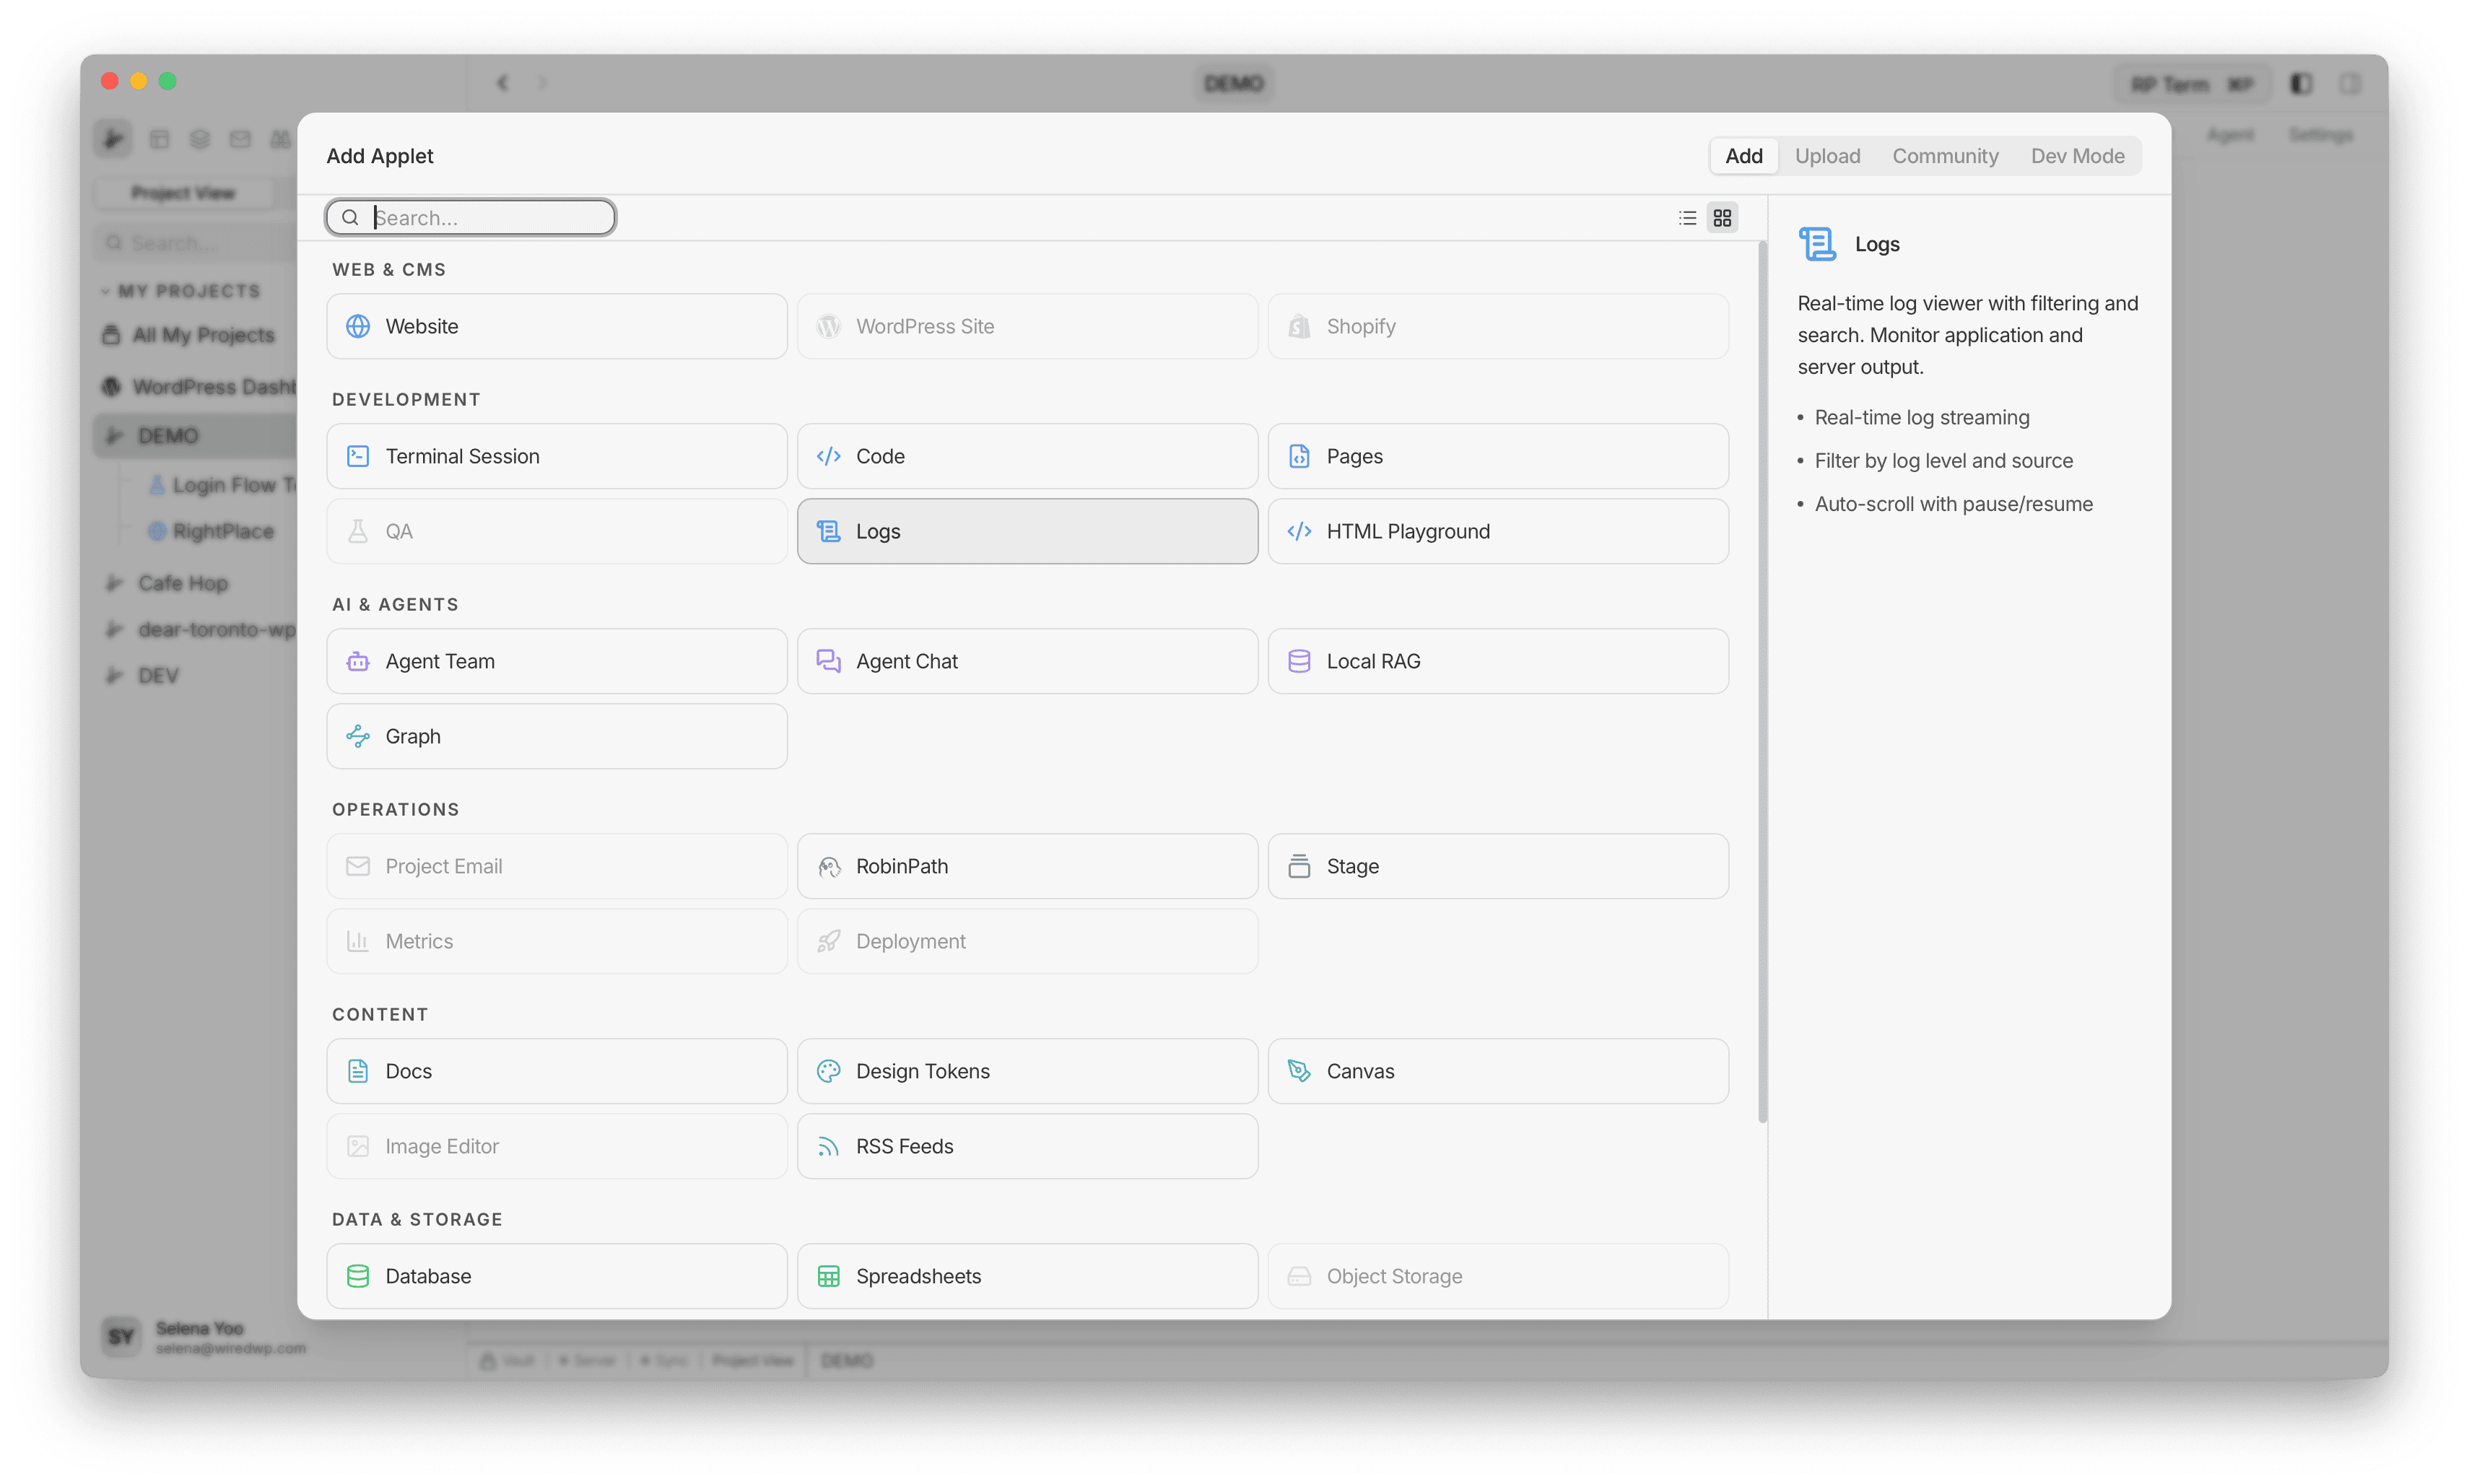
Logs
Real-time log viewer with filtering and search. Monitor application and server output.
Features
- Multiple log sources in one applet
- Live tail with pause, resume, and jump-to-latest
- Level filters, search, and advanced regex exclusions
- Virtualized rendering for large log streams
All your logs, one place to watch
Logs end up in different places. Server output in one terminal, error logs in a file, API responses in a browser tab. When something breaks, you spend more time finding the right log than reading it.
The Logs applet pulls everything into your project. Local files, remote endpoints, and WordPress error logs stream into a single view with live tailing, level filters, and search.
- One stream, many sources. Tail local files, poll API endpoints, and watch WordPress logs side by side. No terminal juggling.
- Filter the noise. Toggle log levels, search by keyword or regex, exclude patterns, and narrow by time range. See only what matters.
- Live tail that keeps up. New lines stream in as they happen. Pause to inspect, resume when ready, jump to latest with one click.
- Built for volume. Virtualized rendering handles thousands of lines without slowing down. Large streams stay smooth.
- Stay in context. Your logs sit next to the code, tasks, and tools they relate to. Diagnose and fix without switching apps.
Adding a Logs applet
Open Add Resource and choose Logs in the Development category.
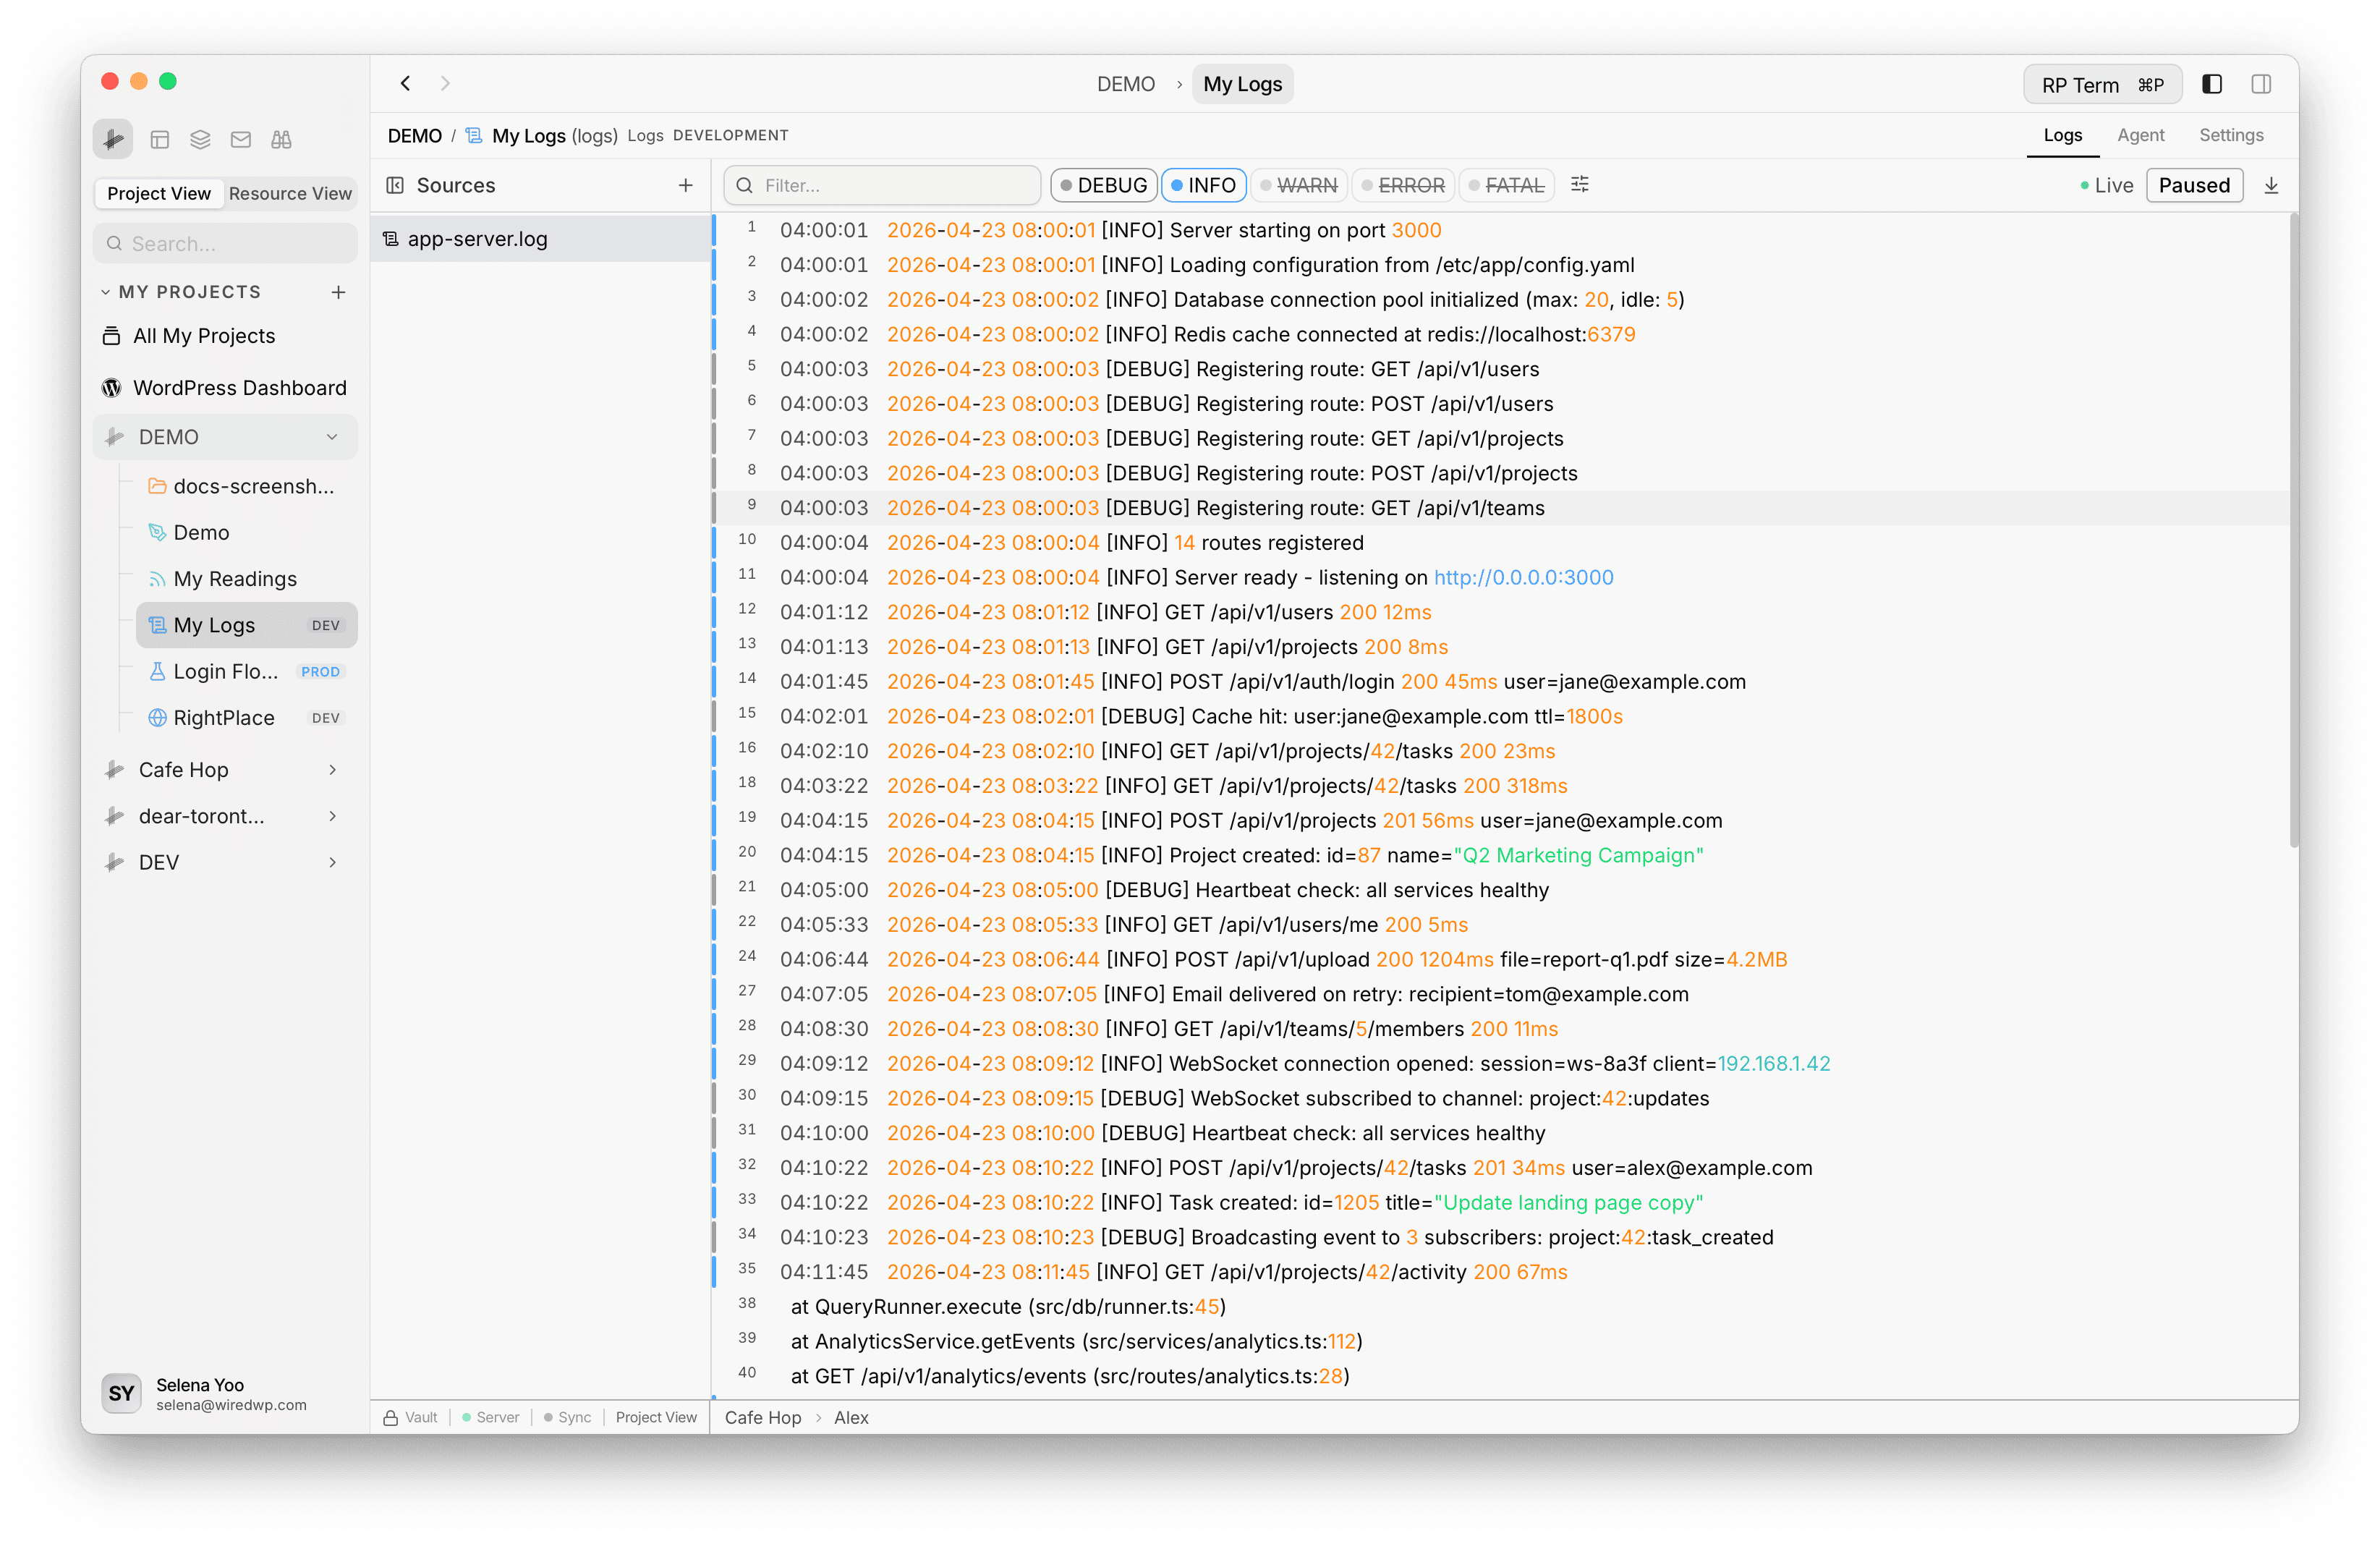
Viewer layout
The page is split into two areas:
- Sources sidebar on the left for selecting and managing log entries
- Viewer pane on the right for the stream, filters, and tail controls
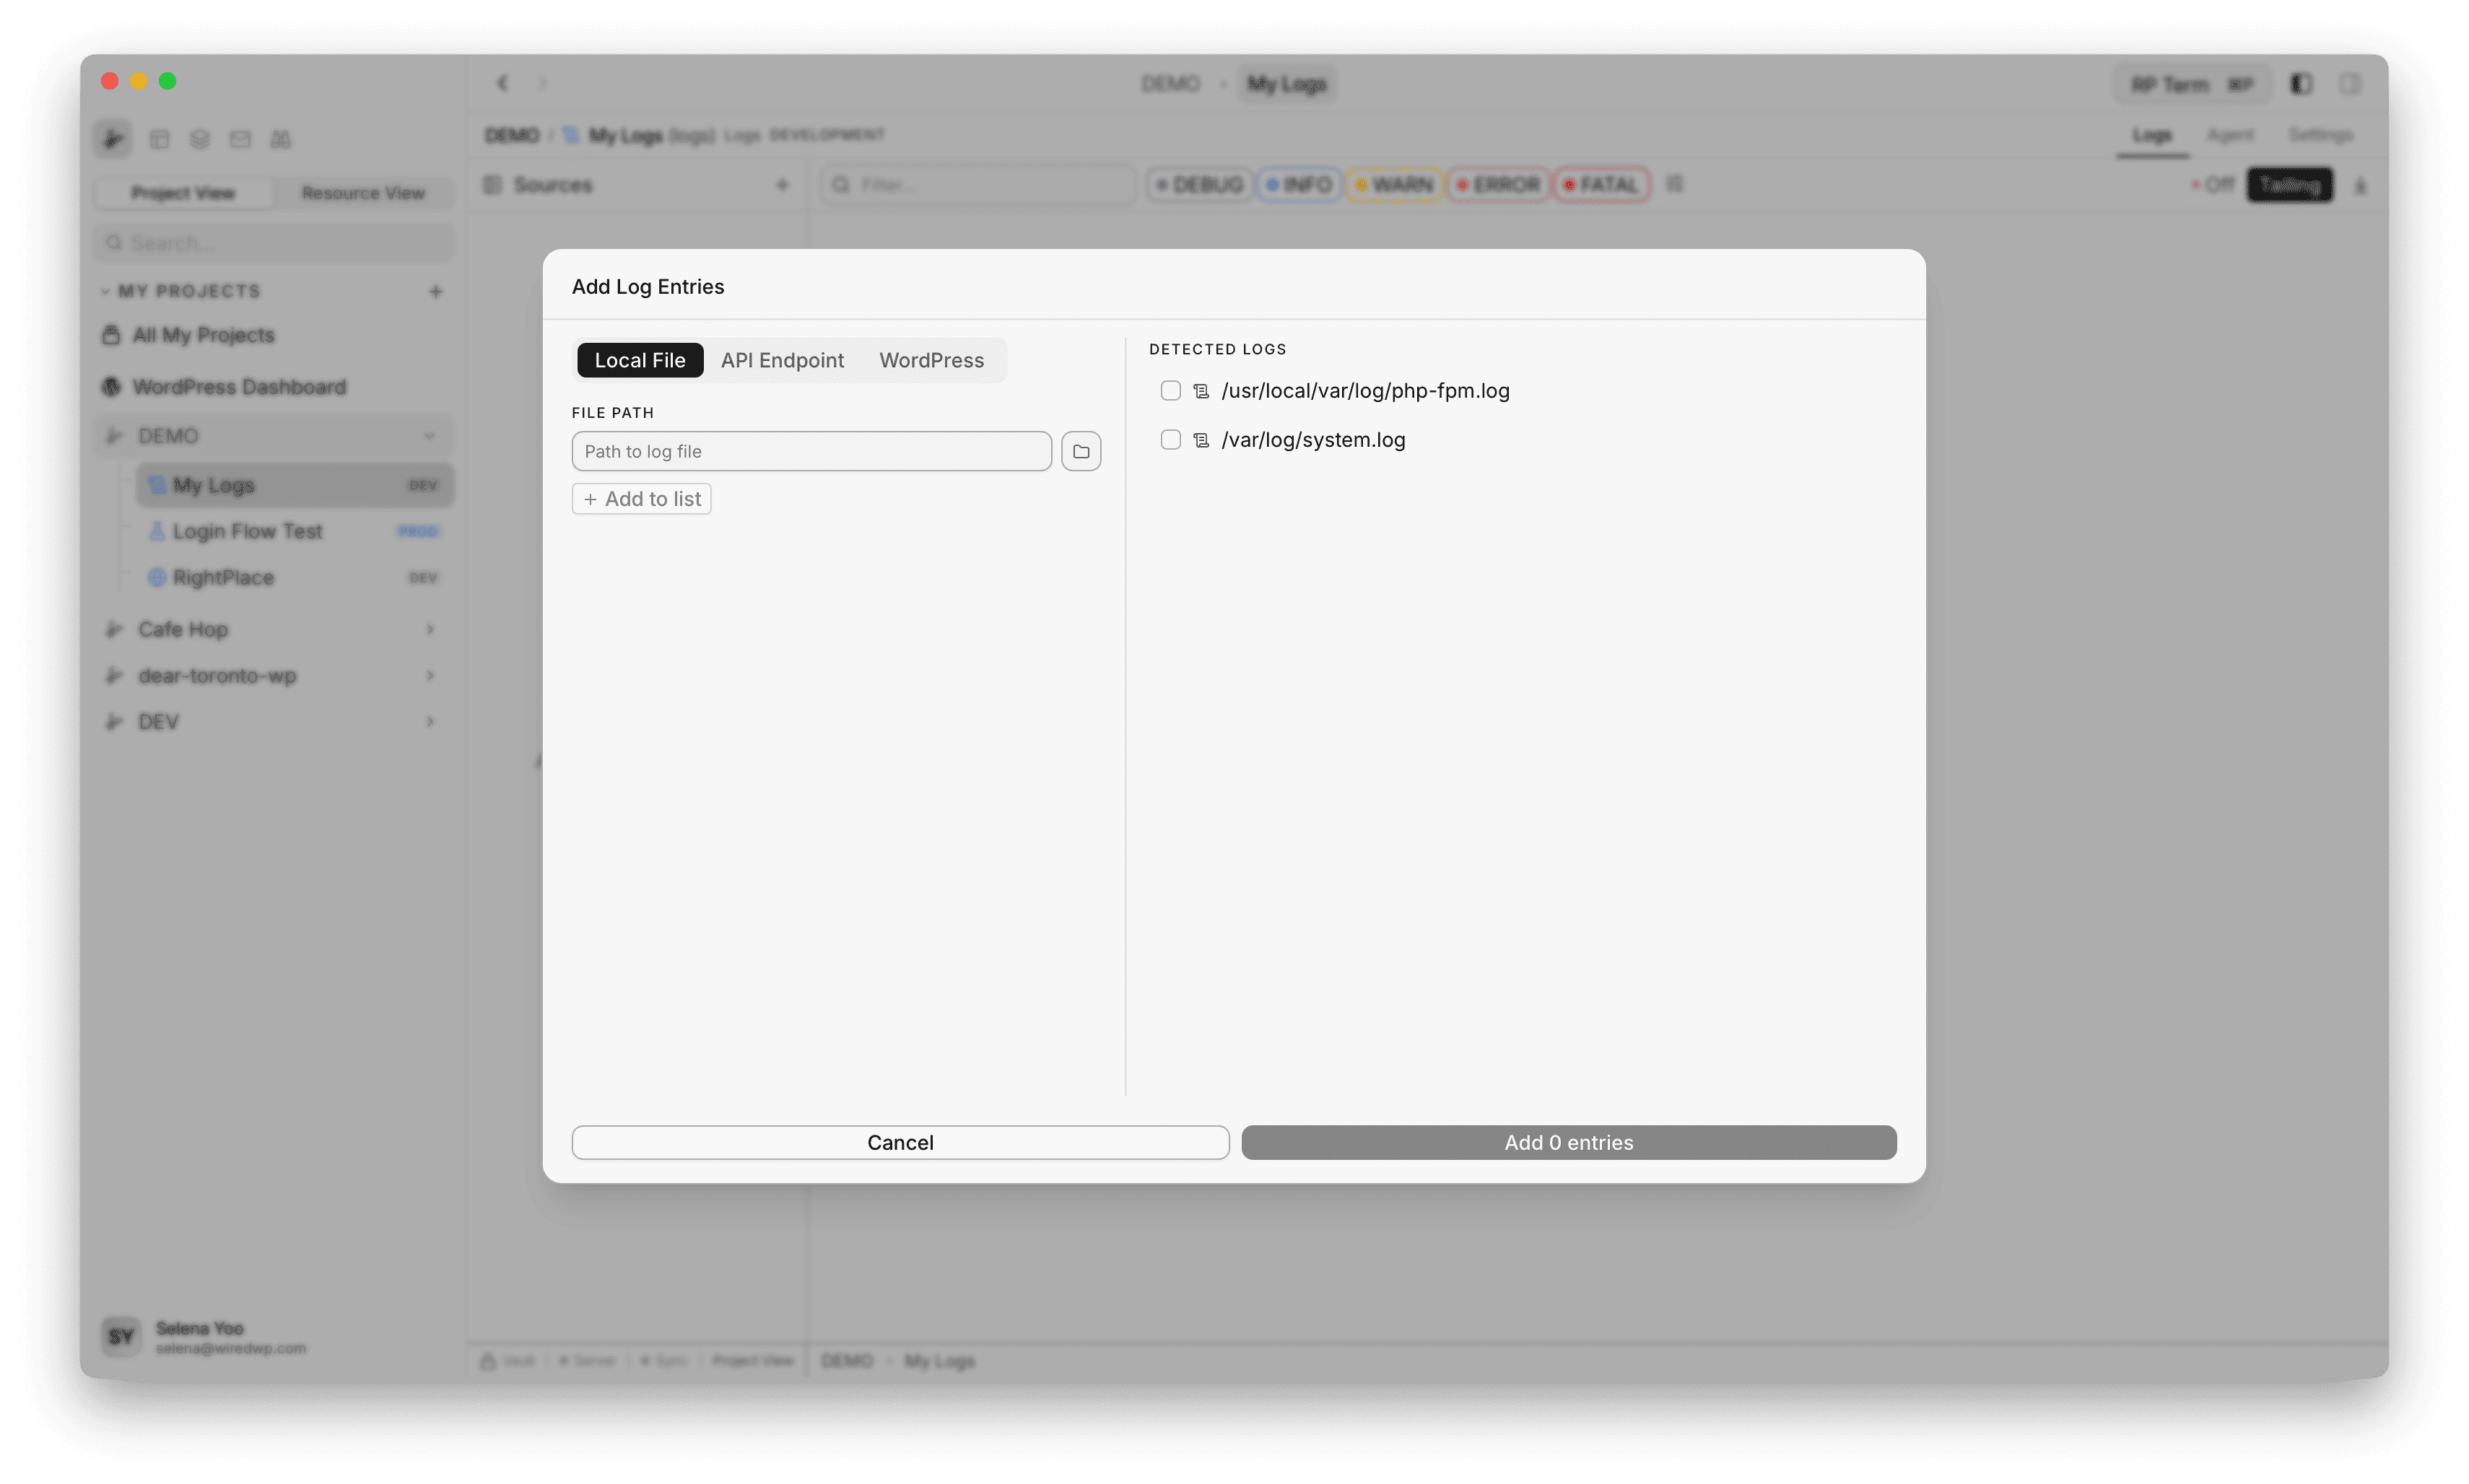
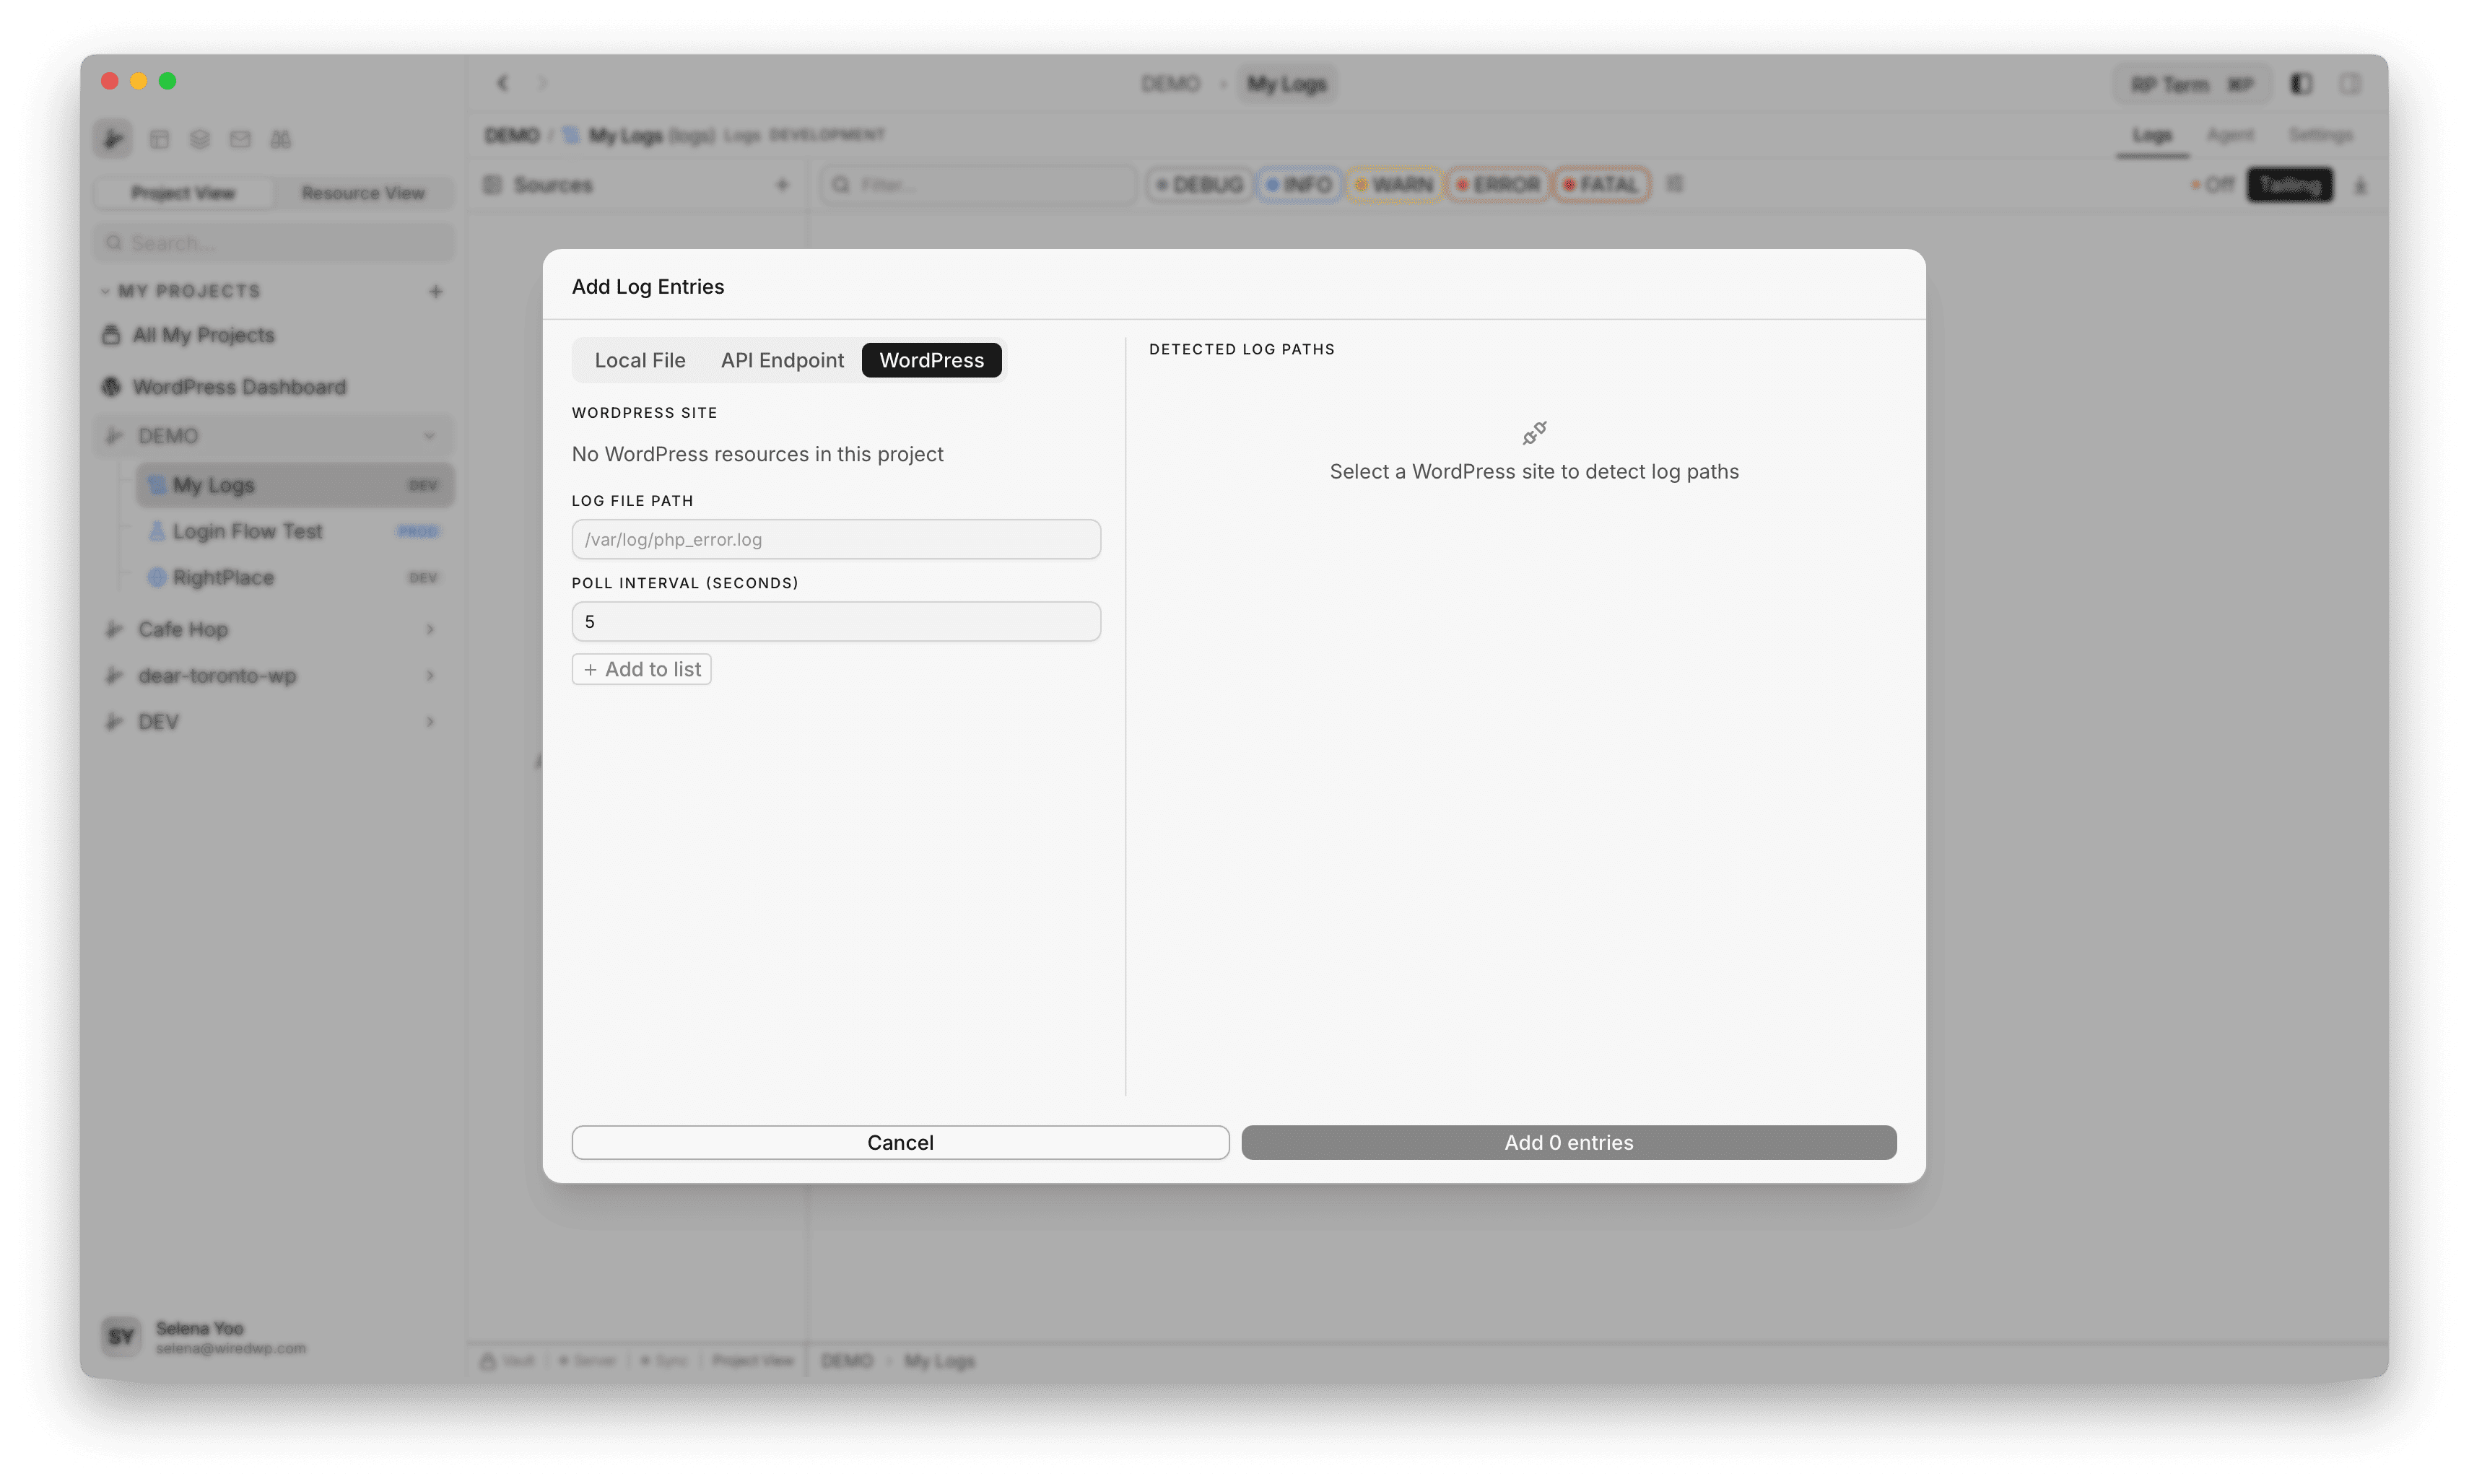
Adding log sources
Use the + button in the Sources sidebar to open Add Log Entries.
Supported source types:
- Local File: tail a file path on disk
- API Endpoint: poll an HTTP endpoint on an interval
- WordPress: poll a selected WordPress resource log path
Local file sources
For local files, Logs supports:
- File picker input
- Auto-discovery of common system and dev log locations
- Multi-select from discovered paths before adding
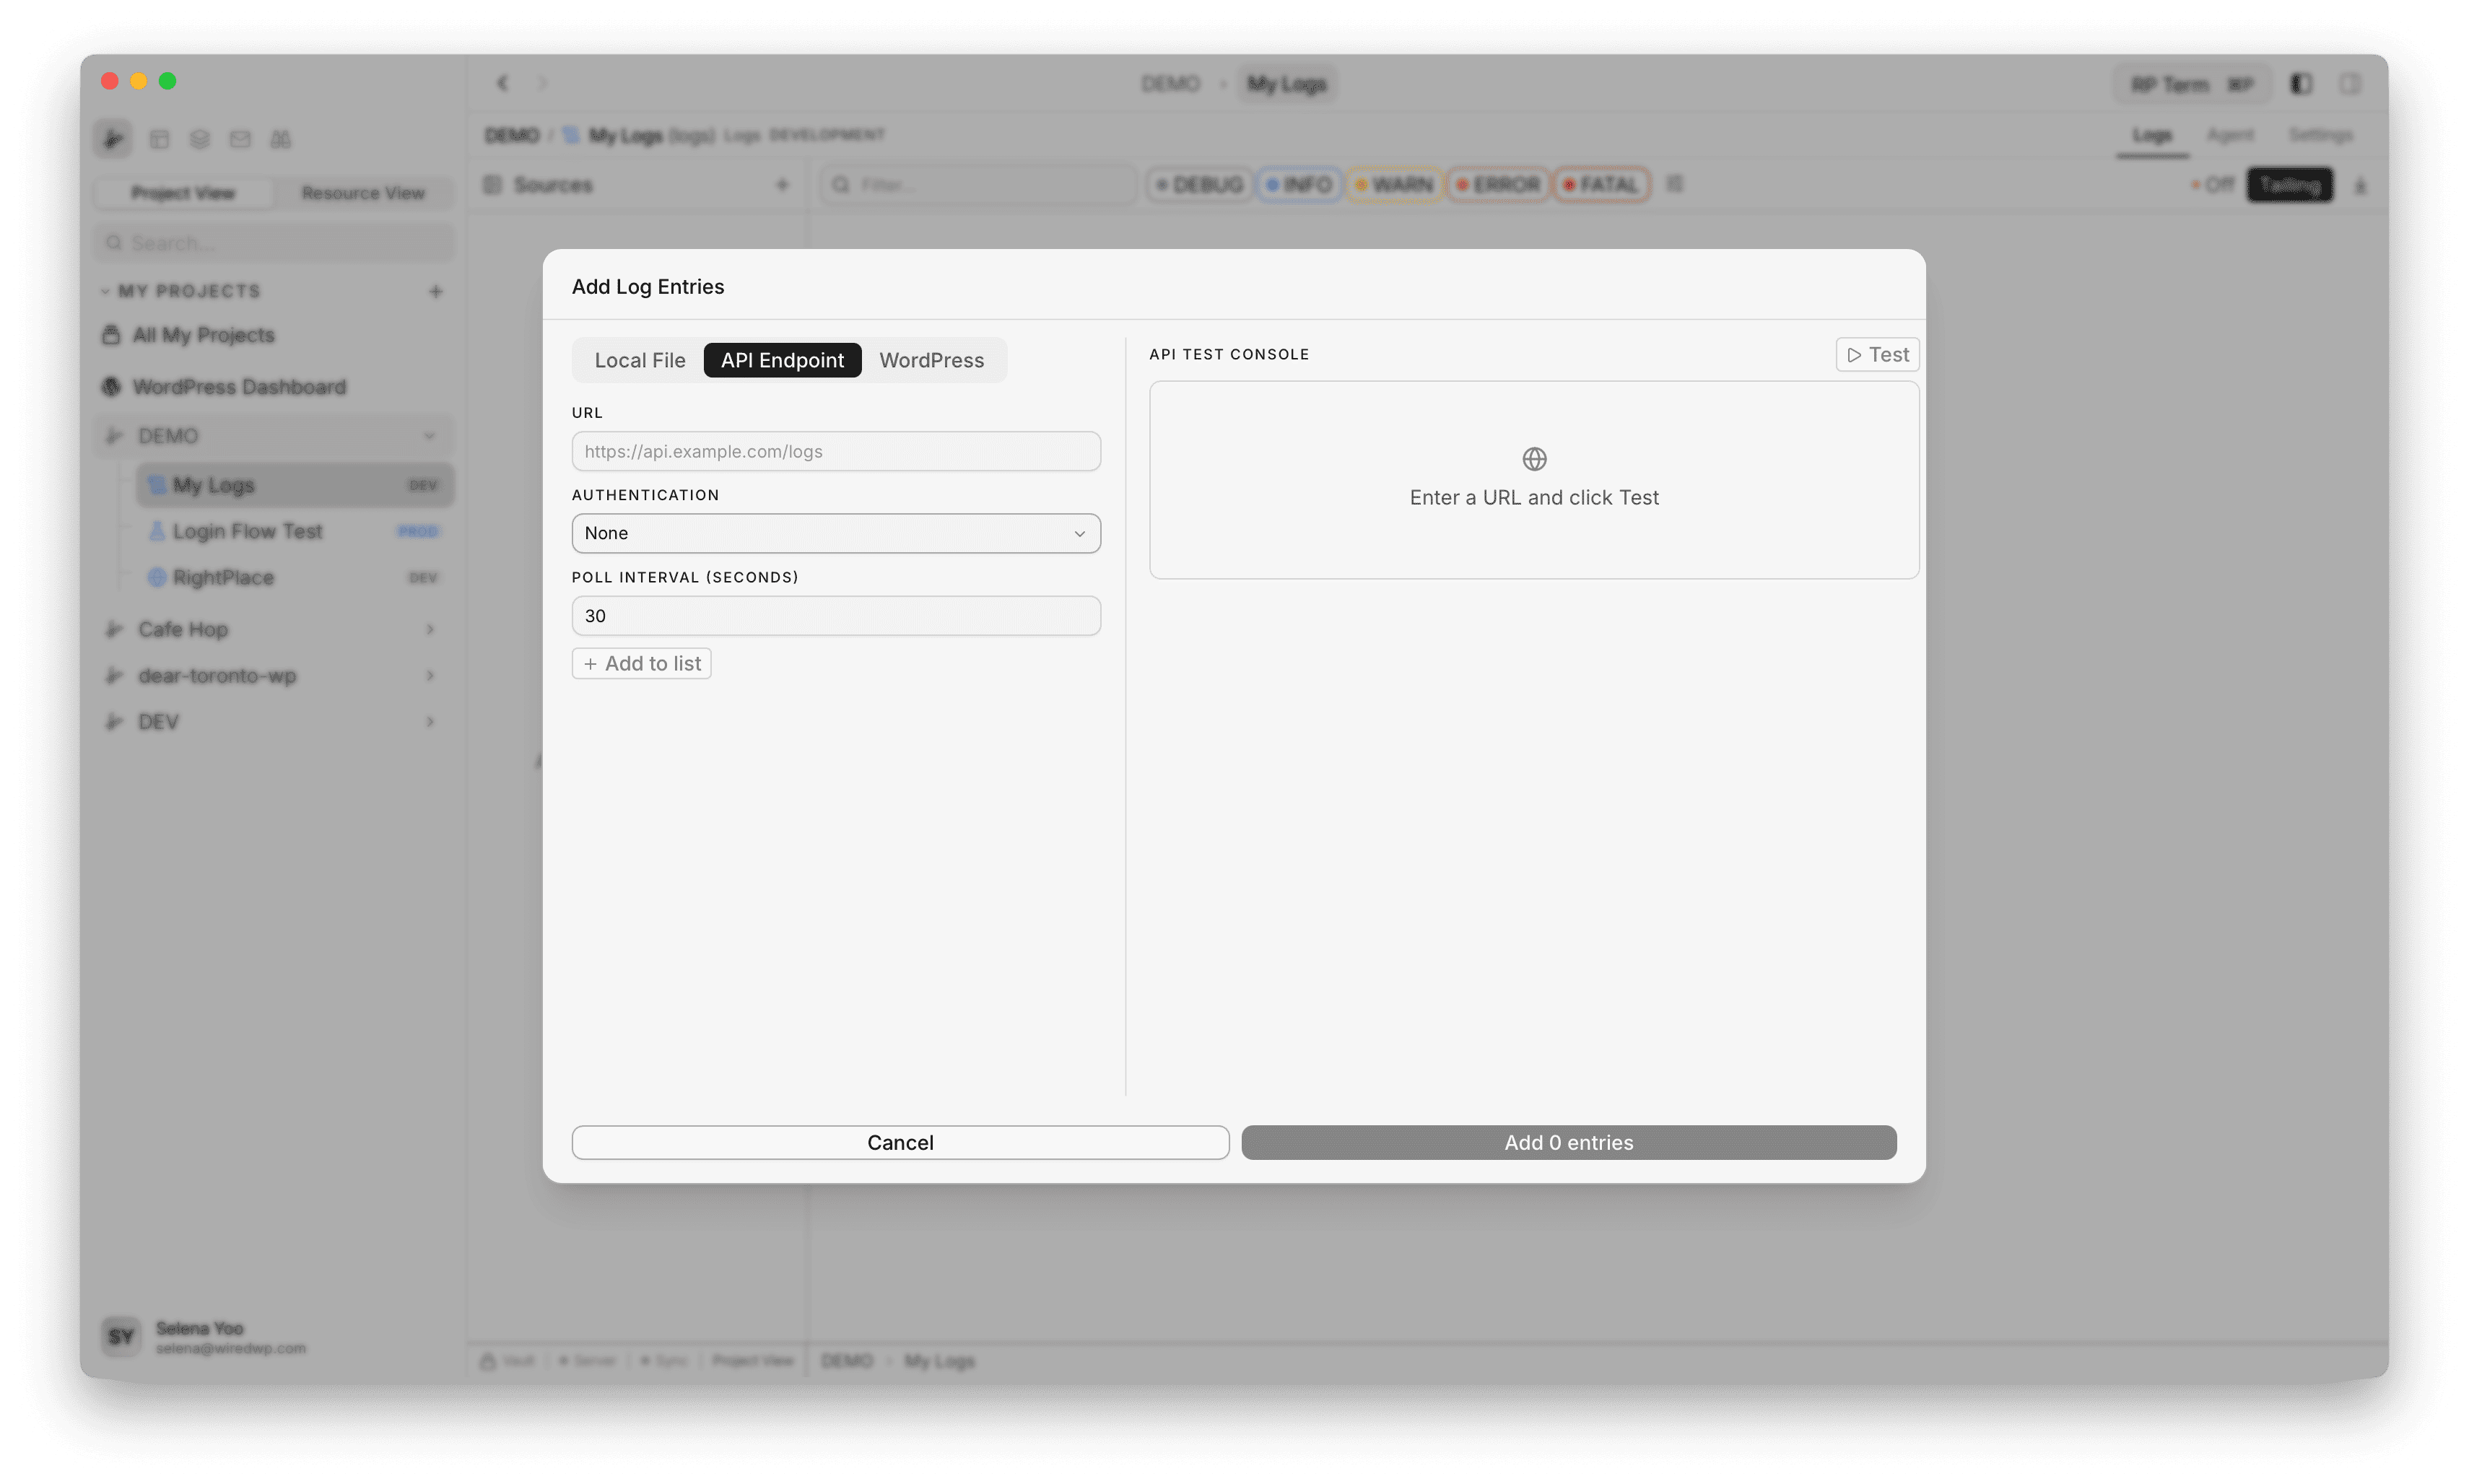
API sources
For API entries, you can configure:
- URL
- Auth type (
None,API Key,Basic Auth) - Poll interval
- Built-in test console before adding
Credentials are stored securely and linked to each API log entry.
WordPress sources
When connected to WordPress, Logs can:
- List project WordPress resources
- Detect likely PHP error log paths
- Add selected path with polling interval
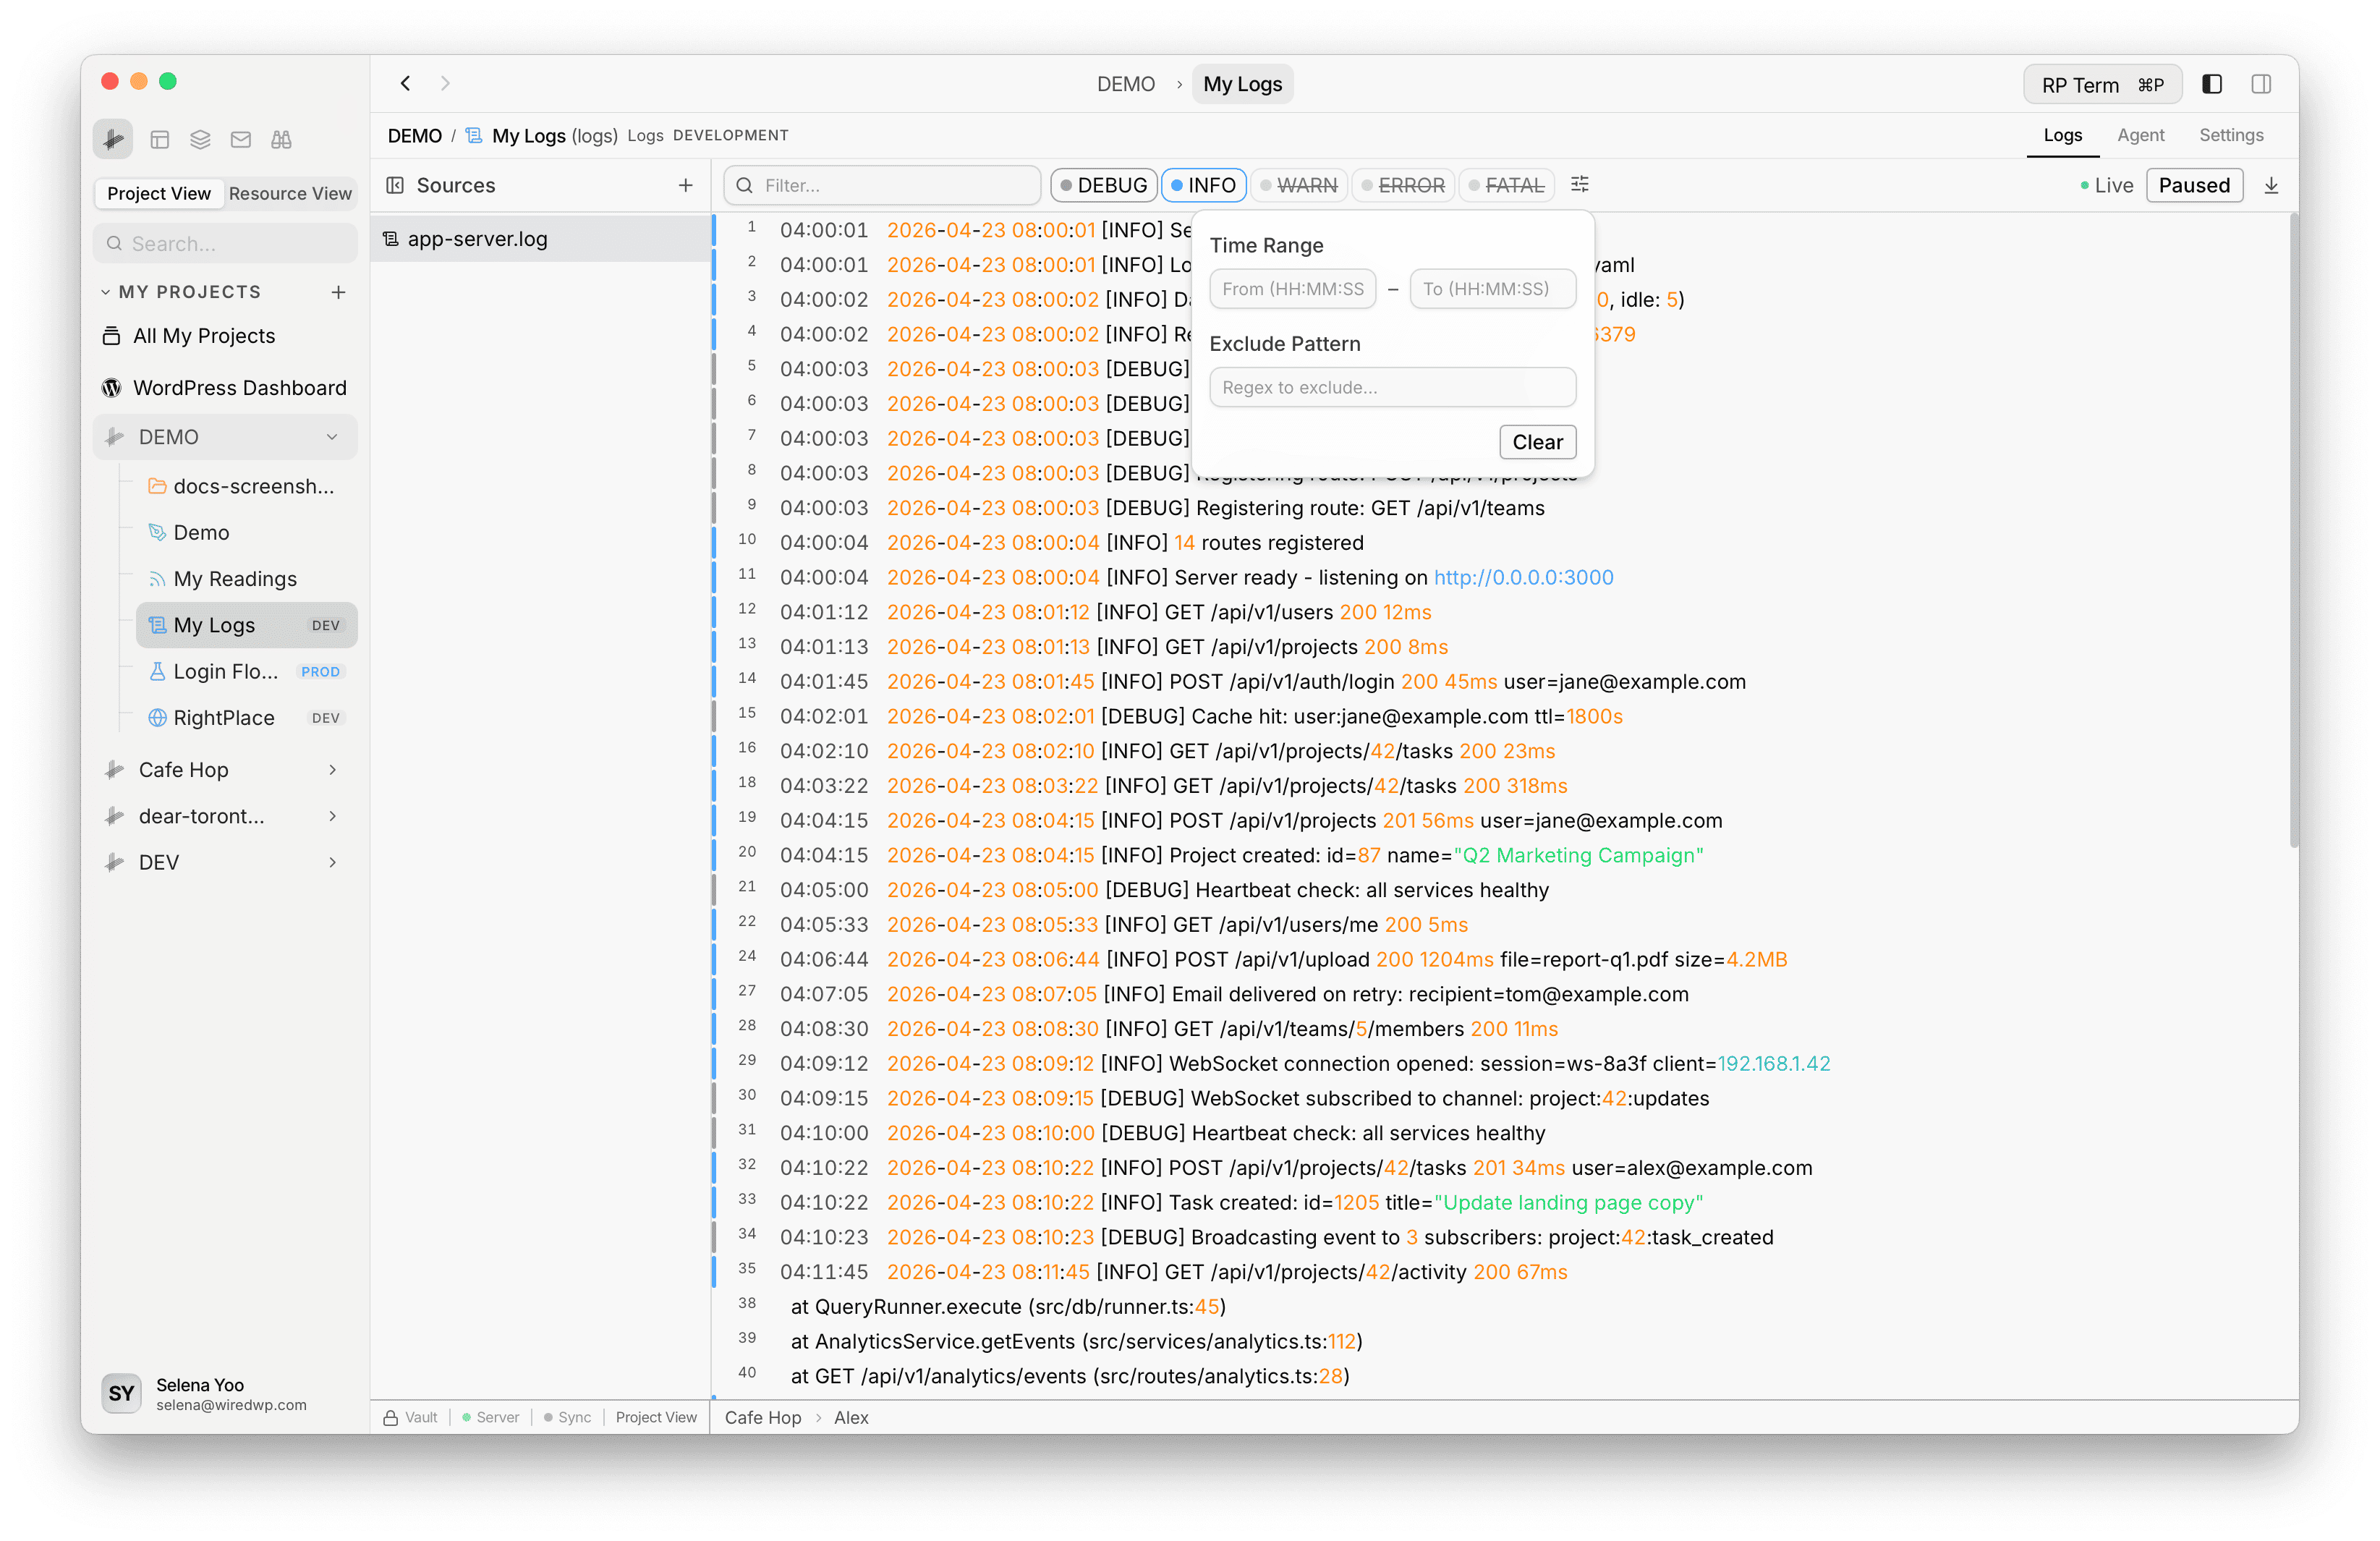
Stream controls and filtering
The viewer toolbar includes:
- Search filter (substring or regex if valid)
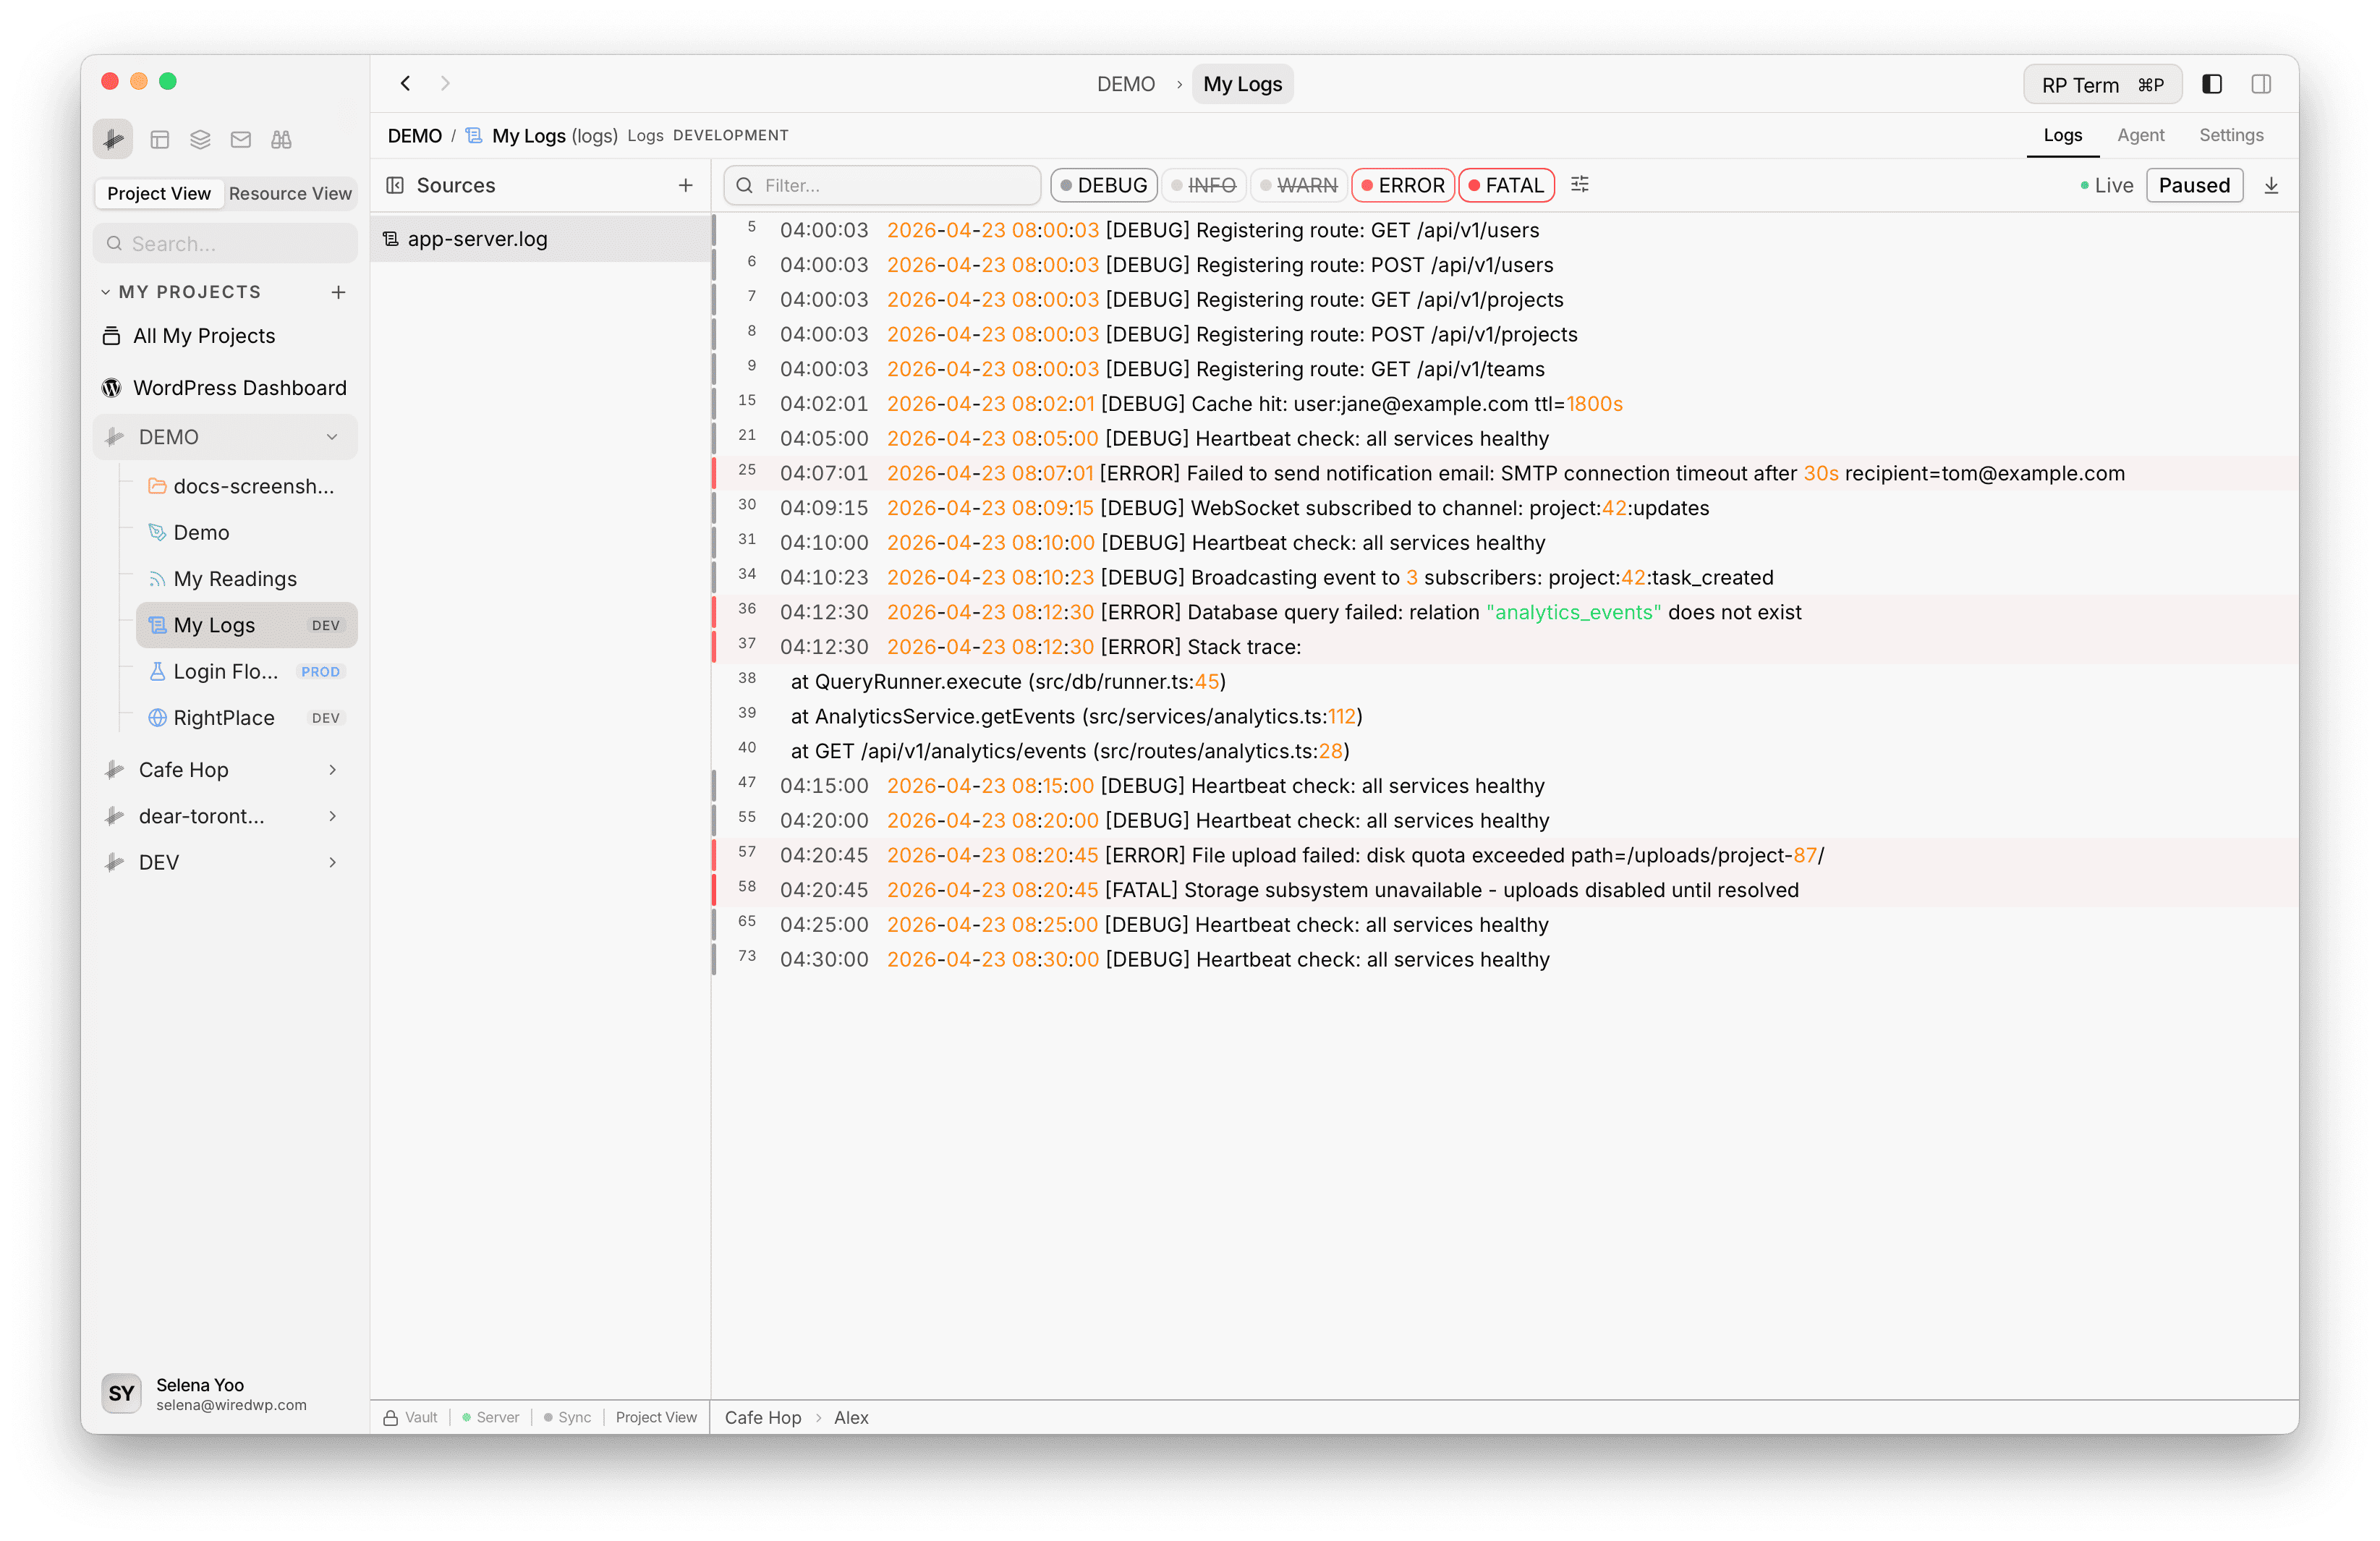
- Level toggles:
DEBUG,INFO,WARN,ERROR,FATAL - Advanced filters:
- Time range (
FromandToinHH:MM:SS) - Exclude regex pattern
- Time range (
- Connection indicator (
LiveorOff) - Tailing toggle (
TailingorPaused) - Jump to latest button
Log line behavior
Each line includes:
- Line number
- Parsed timestamp (when available)
- Severity marker
- Highlighted values (strings, URLs, IPs, numeric tokens)
JSON lines can be expanded inline for pretty-printed view.
New incoming lines are briefly highlighted so recent updates are easy to spot.
Context menu actions
Right-click a log row to access quick actions:
- Copy selection
- Copy line
- Copy with timestamp
- Copy as pretty JSON (for JSON lines)
- Filter by current level
Performance and limits
Logs is optimized for large streams:
- Buffered ingest and periodic flush for smooth rendering
- Virtualized row rendering
- In-memory cap of recent lines to prevent uncontrolled growth
Widget
Appears when a Logs tab is active. Reserved for future log-specific widgets.
Agent tools
Every action this applet exposes as a typed, permissioned tool that agents can discover and run over MCP, the same actions your team uses in the UI.